CONCENTRATE
Pricing
ModelsDocsRequest a Demo

Usage Monitoring

See every request, dollar, and error in one dashboard

Track requests, tokens, spend, and error rate on one dashboard, then open request-level logs with model, cost, duration, and token counts across every team and provider.

Request a demoRead docs
Dashboard showing AI usage by department and provider with errors, latency, and cost summary cards
Request log

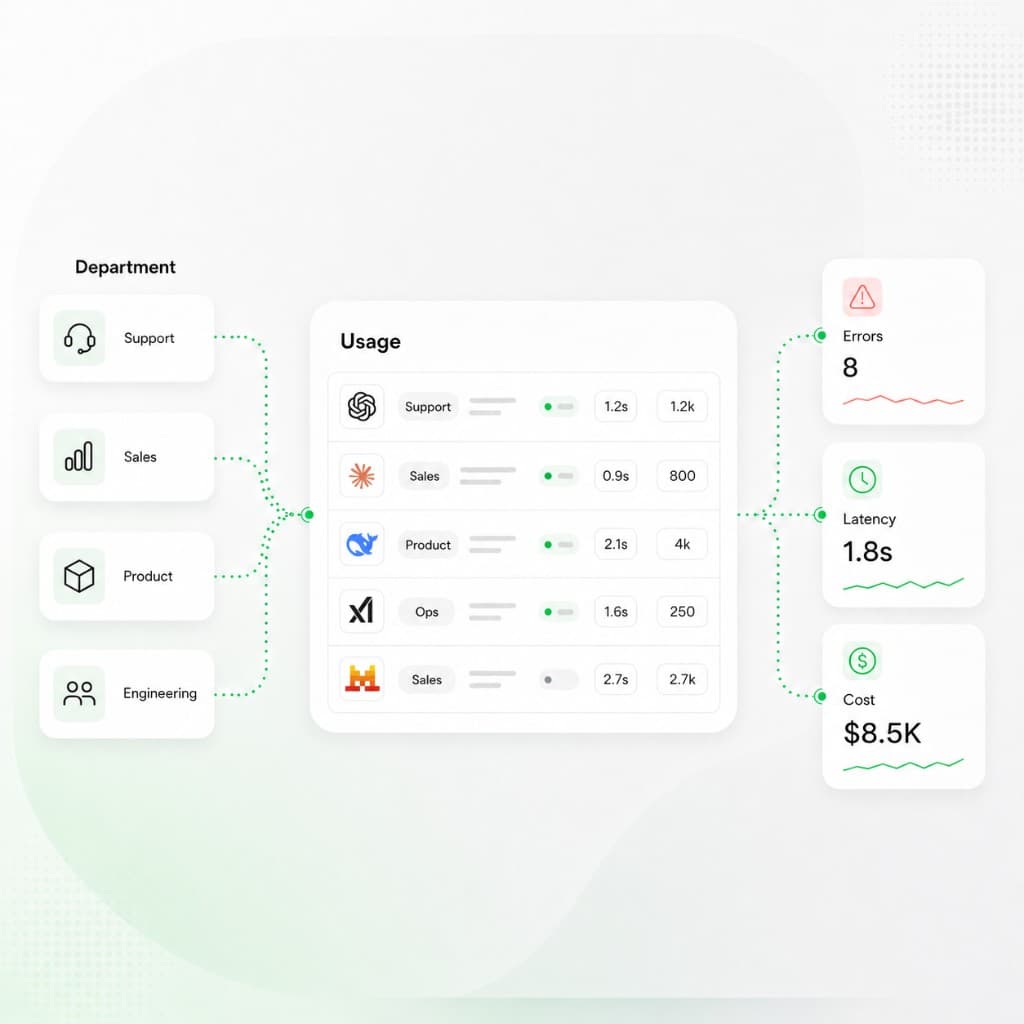
Each model call with status, model, provider, duration, cost, and token counts — filterable and exportable.

Charts

Spend + tokens

Logs

Request-level

Error rate

On dashboard

Requests

128,400

Total requests, tokens, spend, and error rate for the date range.

Status

Success / failed

Each logged request is marked success or failed and can be filtered.

Duration

1.8s

Per-request response time shown in the logs table.

Cost

$0.041

Request-level spend with input, output, and cached tokens.

New capabilities

What your team gains with Concentrate

01

Usage dashboard

See total requests, tokens, spend, and active keys, plus error rate and error count for the date range you pick.

02

Spend and token charts

Read cost over time and tokens over time, including input, output, and cached tokens, broken down by API key or in total.

03

Spend by model and provider

See how spend splits across models and providers, with each one's share of the total. More in provider and model spend breakdowns.

04

Request logs

Open a request-level table with status, model, duration, cost, and token counts, and expand any row for the full request and response.

05

Filter and export

Filter logs by status, time window, and team, then export the rows you need to CSV.

06

Error rate and alerts

Watch error rate on the dashboard and set email alerts for error spikes, spend spikes, and keys near their balance.

Who Concentrate is designed for

Teams watching AI usage, spend, and errors together

The dashboard and request logs are the shared record for engineering, finance, and leadership as AI usage grows. Pair them with spend management for limits and access controls for who can see raw content.

On-call debugging

Filter logs by status, time, and team, open a failed request, and read its duration, tokens, and full request and response. When a provider is the problem, change the path in request routing.

Spend review

Tie dashboard spend by model, provider, and key back to the workloads that drove the bill, then act on it in spend management.

Capacity and errors

Watch error rate and per-key request counts so a failing key or provider shows up before users report it.

Privacy for reviewers

Let leaders review usage and spend while prompt and response text stays hidden with data redaction.

Usage Monitoring basics

Frequently asked questions

What does the usage dashboard show?
Total requests, tokens, spend, and active keys for the date range you pick, plus error rate and error count. Two line charts plot spend over time and tokens over time, and breakdowns show spend by model, provider, and API key. For limits and attribution, see spend management.
How do engineers debug LLM failures?
Open request logs and filter by status, time, and team. Each request shows the model, duration, cost, and token counts, and you can expand a row for the full request and response. If the failures trace back to one provider, change the route in request routing.
Can leaders review usage without seeing raw prompts?
Yes. The dashboard and usage views show spend, requests, errors, and the model and provider mix without prompt text. In an organization, data redaction hides request and response content in logs, and access controls decide who can see what.
How does monitoring help lower spend?
Logs and charts show which workloads produce high token counts, expensive output, or frequent failures. Those are the first candidates for prompt changes, cheaper routes in request routing, or tighter spend limits. Export request logs or billing usage to CSV when finance needs the detail.
CONCENTRATE

One API for every major LLM provider — routing, spend, logs, and controls in one place.

New York

130 E 59th St, 17th floor

New York, NY 10022

Wilmington

1201 N. Market Street, Suite 200

Wilmington, DE 19801

LLM Gateway
  • LLM Gateway
  • Request Routing
  • Usage Monitoring
  • Spend Management
  • Data Security
  • Access Controls
Teams
  • AI Engineering
  • Engineering Leadership
  • Finance & Operations
  • Security & Compliance
Integrations
  • All Integrations
  • Migration Guides
Platform
  • Pricing
  • Model Fortress
  • Enterprise
  • Documentation
  • Status
Legal
  • Privacy Policy
  • Terms of Service
  • Data Processing Addendum
  • Acceptable Use Policy
Features
  • Universal API Keys
  • Spend Tracking
  • Token Allocation
  • Usage Analytics
  • Request Logs
  • Alerts
  • Data Redaction
  • Zero Data Retention
  • Audit Logs

LLM Gateway

  • LLM Gateway
  • Request Routing
  • Usage Monitoring
  • Spend Management
  • Data Security
  • Access Controls

Teams

  • AI Engineering
  • Engineering Leadership
  • Finance & Operations
  • Security & Compliance

Integrations

  • All Integrations
  • Migration Guides

Platform

  • Pricing
  • Model Fortress
  • Enterprise
  • Documentation
  • Status

Legal

  • Privacy Policy
  • Terms of Service
  • Data Processing Addendum
  • Acceptable Use Policy

Features

  • Universal API Keys
  • Spend Tracking
  • Token Allocation
  • Usage Analytics
  • Request Logs
  • Alerts
  • Data Redaction
  • Zero Data Retention
  • Audit Logs

Offices

New York

130 E 59th St, 17th floor

New York, NY 10022

Wilmington

1201 N. Market Street, Suite 200

Wilmington, DE 19801

© 2026 Concentrate AI. All rights reserved.

CONCENTRATE
Log In
Log In